Data Presentation Using Geogebra for Beginners
The Knowledge Sharing and Communication Committee of the Centre
for Foundation Studies, Kampar Campus, ran an online talk titled “Data
Presentation Using Geogebra for Beginners” on 23 June 2021 via Microsoft Teams.
Chong Fook Seng, Lecturer with the Department of Science and Engineering,
Centre for Foundation Studies, Kampar Campus Lecturer, delivered the session
specifically tailored to students at the Centre enrolled for Mathematics
related courses.

The objectives of the talk were to demonstrate the use of GeoGebra as a possible tool to enhance statistical data representation in Mathematics courses, and to assist students in improving data presentation using GeoGebra to enhance the students’ rate of employability and job opportunities.
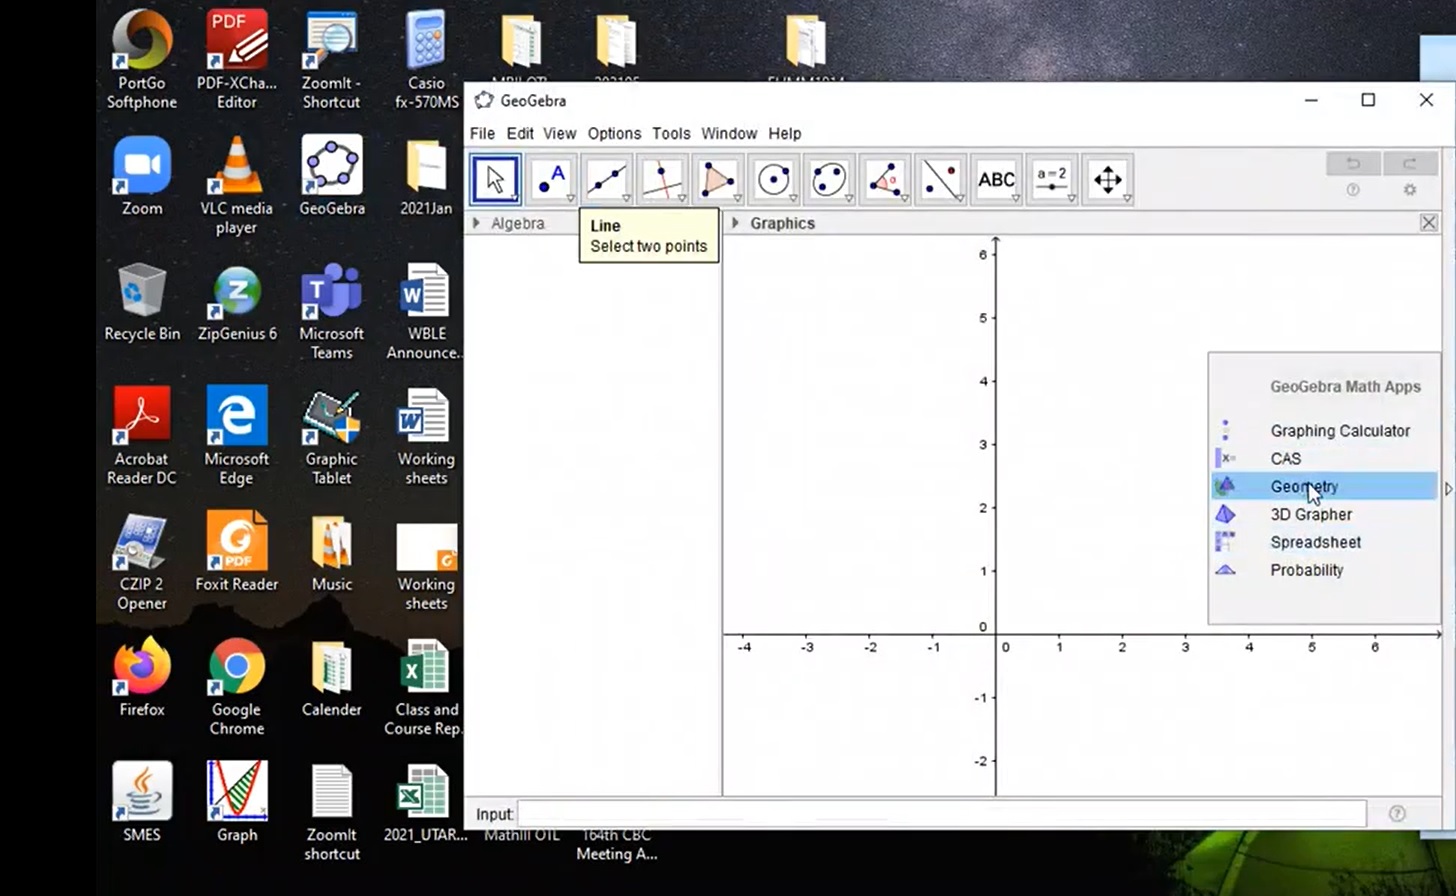
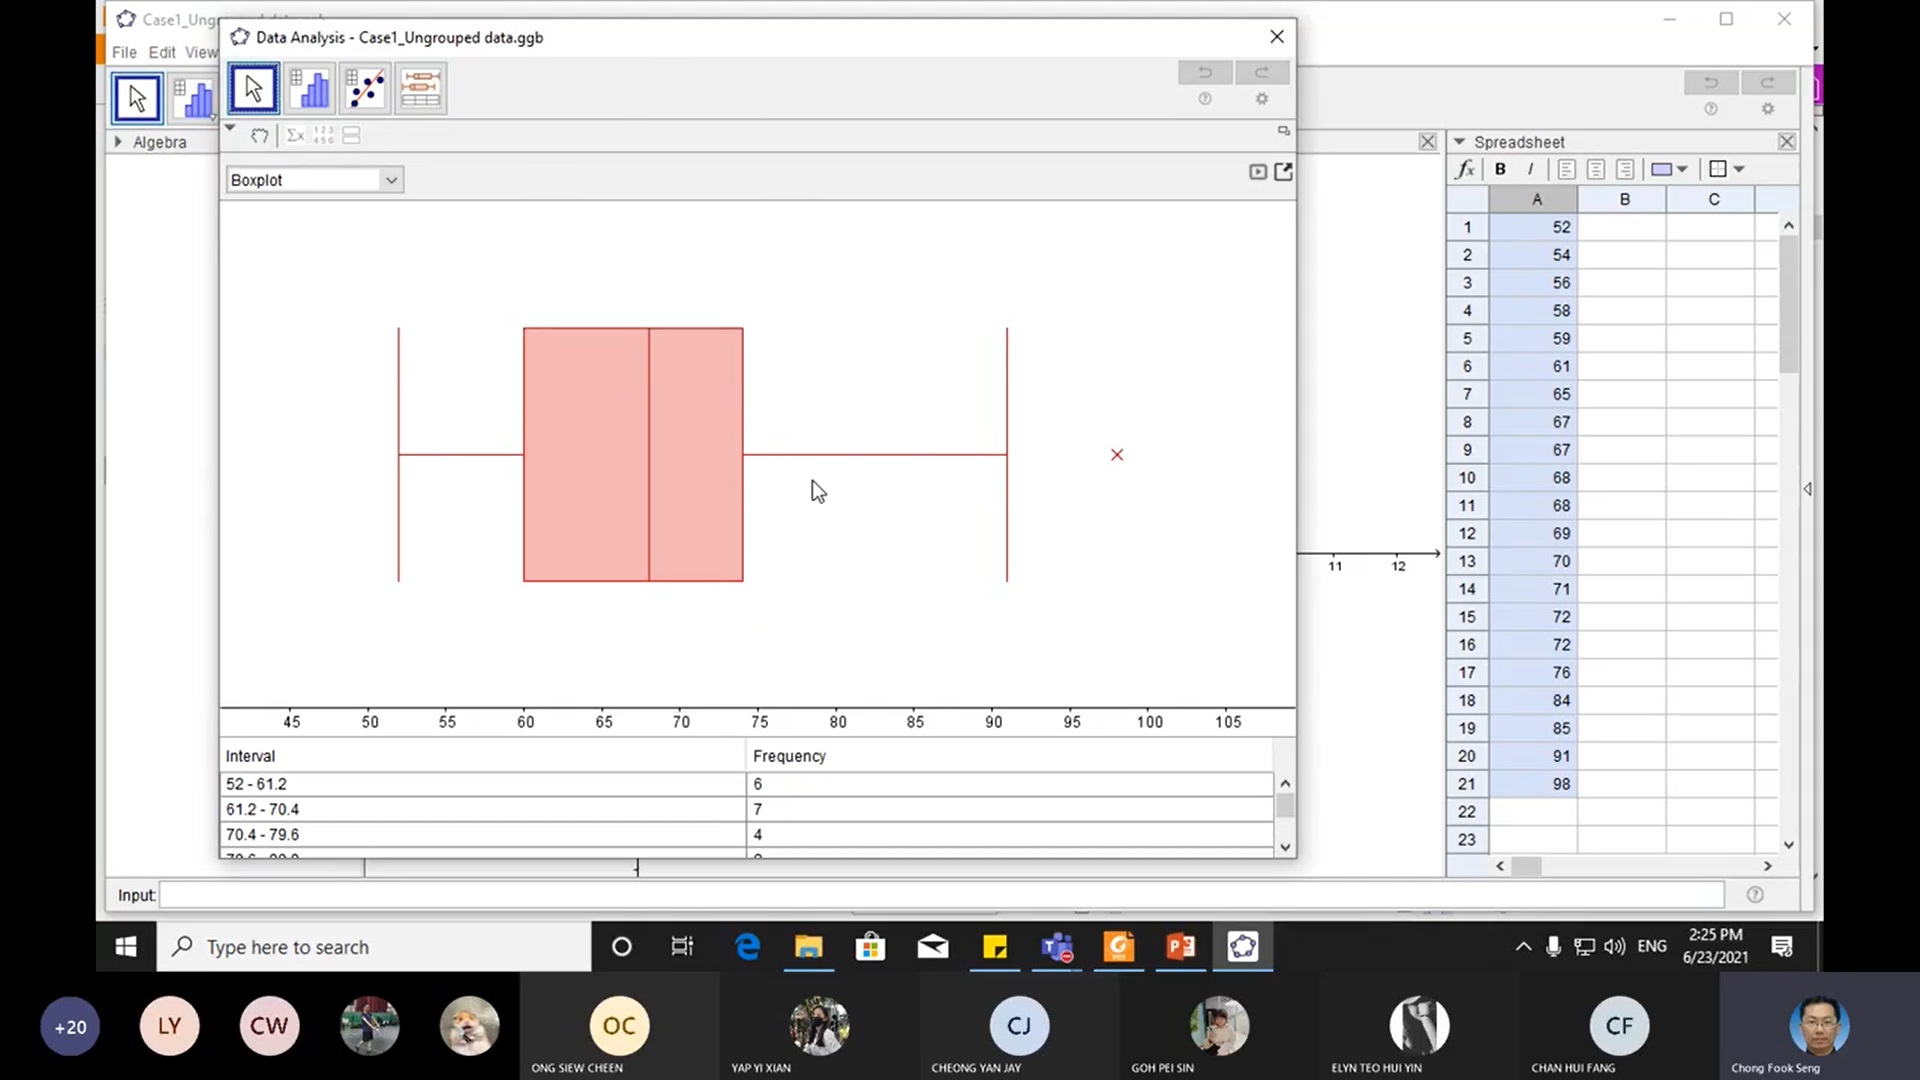
During the session, Chong introduced participants to the currently free software, Geogebra that functions as a useful tool in representing data graphically. Chong alerted the participants that although the software provided a means by which they could enhance their own data presentation in assignments, group discussions and possibly final-year projects, it was not to be applied to online assessments, tests or examinations as these would still require the mandatory conventional working steps to be shown for each problem.
The 90-minute duration also allowed participants to be briefed on methods of running calculation on the probability for discrete and continuous random variable events as well as analysing bivariate data along with forecasting based on modeling obtained.


The interactive talk then ended with a Q&A session, in which participants sought further information on Geogebra’s capabilities as a data representation tool in areas such as 3-D representation and modelling.

